VPP on FreeBSD - Part 2
About this series
![]()
Ever since I first saw VPP - the Vector Packet Processor - I have been deeply impressed with its performance and versatility. For those of us who have used Cisco IOS/XR devices, like the classic ASR (aggregation services router), VPP will look and feel quite familiar as many of the approaches are shared between the two. Over the years, folks have asked me regularly “What about BSD?” and to my surprise, late last year I read an announcement from the FreeBSD Foundation [ref] as they looked back over 2023 and forward to 2024:
Porting the Vector Packet Processor to FreeBSD
Vector Packet Processing (VPP) is an open-source, high-performance user space networking stack that provides fast packet processing suitable for software-defined networking and network function virtualization applications. VPP aims to optimize packet processing through vectorized operations and parallelism, making it well-suited for high-speed networking applications. In November of this year, the Foundation began a contract with Tom Jones, a FreeBSD developer specializing in network performance, to port VPP to FreeBSD. Under the contract, Tom will also allocate time for other tasks such as testing FreeBSD on common virtualization platforms to improve the desktop experience, improving hardware support on arm64 platforms, and adding support for low power idle on Intel and arm64 hardware.
In my first [article], I wrote a sort of a hello world by installing FreeBSD 14.0-RELEASE on both a VM and a bare metal Supermicro, and showed that Tom’s VPP branch compiles, runs and pings. In this article, I’ll take a look at some comparative performance numbers.
Comparing implementations
FreeBSD has an extensive network stack, including regular kernel based functionality such as routing, filtering and bridging, a faster netmap based datapath, including some userspace utilities like a netmap bridge, and of course completely userspace based dataplanes, such as the VPP project that I’m working on here. Last week, I learned that VPP has a netmap driver, and from previous travels I am already quite familiar with its DPDK based forwarding. I decide to do a baseline loadtest for each of these on the Supermicro Xeon-D1518 that I installed last week. See the [article] for details on the setup.
The loadtests will use a common set of different configurations, using Cisco T-Rex’s default
benchmark profile called bench.py:
- var2-1514b: Large Packets, multiple flows with modulating source and destination IPv4 addresses, often called an ‘iperf test’, with packets of 1514 bytes.
- var2-imix: Mixed Packets, multiple flows, often called an ‘imix test’, which includes a bunch of 64b, 390b and 1514b packets.
- var2-64b: Small Packets, still multiple flows, 64 bytes, which allows for multiple receive queues and kernel or application threads.
- 64b: Small Packets, but now single flow, often called ‘linerate test’, with a packet size of 64 bytes, limiting to one receive queue.
Each of these four loadtests might occur in only undirectionally (port0 -> port1) or bidirectionally (port0 <-> port1). This yields eight different loadtests, each taking about 8 minutes. I put the kettle on and get underway.
FreeBSD 14: Kernel Bridge
The machine I’m testing has a quad-port Intel i350 (1Gbps copper, using the FreeBSD igb(4) driver),
a dual-port Intel X522 (10Gbps SFP+, using the ix(4) driver), and a dual-port Intel i710-XXV
(25Gbps SFP28, using the ixl(4) driver). I decide to live it up a little, and choose the 25G ports
for my loadtests today, even if I think this machine with its relatively low-end Xeon-D1518 CPU
will struggle a little bit at very high packet rates. No pain, no gain, amirite?
I take my fresh FreeBSD 14.0-RELEASE install, without any tinkering other than compiling a GENERIC kernel that has support for the DPDK modules I’ll need later. For my first loadtest, I create a kernel based bridge as follows, just tying the two 25G interfaces together:
[pim@france /usr/obj]$ uname -a
FreeBSD france 14.0-RELEASE FreeBSD 14.0-RELEASE #0: Sat Feb 10 22:18:51 CET 2024     root@france:/usr/obj/usr/src/amd64.amd64/sys/GENERIC amd64

[pim@france ~]$ dmesg | grep ixl
ixl0: <Intel(R) Ethernet Controller XXV710 for 25GbE SFP28 - 2.3.3-k> mem 0xf8000000-0xf8ffffff,0xf9008000-0xf900ffff irq 16 at device 0.0 on pci7
ixl1: <Intel(R) Ethernet Controller XXV710 for 25GbE SFP28 - 2.3.3-k> mem 0xf7000000-0xf7ffffff,0xf9000000-0xf9007fff irq 16 at device 0.1 on pci7

[pim@france ~]$ sudo ifconfig bridge0 create
[pim@france ~]$ sudo ifconfig bridge0 addm ixl0 addm ixl1 up
[pim@france ~]$ sudo ifconfig ixl0 up
[pim@france ~]$ sudo ifconfig ixl1 up
[pim@france ~]$ ifconfig bridge0
bridge0: flags=1008843<UP,BROADCAST,RUNNING,SIMPLEX,MULTICAST,LOWER_UP> metric 0 mtu 1500
	options=0
	ether 58:9c:fc:10:6c:2e
	id 00:00:00:00:00:00 priority 32768 hellotime 2 fwddelay 15
	maxage 20 holdcnt 6 proto rstp maxaddr 2000 timeout 1200
	root id 00:00:00:00:00:00 priority 32768 ifcost 0 port 0
	member: ixl1 flags=143<LEARNING,DISCOVER,AUTOEDGE,AUTOPTP>
	        ifmaxaddr 0 port 4 priority 128 path cost 800
	member: ixl0 flags=143<LEARNING,DISCOVER,AUTOEDGE,AUTOPTP>
	        ifmaxaddr 0 port 3 priority 128 path cost 800
	groups: bridge
	nd6 options=9<PERFORMNUD,IFDISABLED>
One thing that I quickly realize, is that FreeBSD, when using hyperthreading, does have 8 threads available, but only 4 of them participate in forwarding. When I put the machine under load, I see a curious 399% spent in kernel while I see 402% in idle:
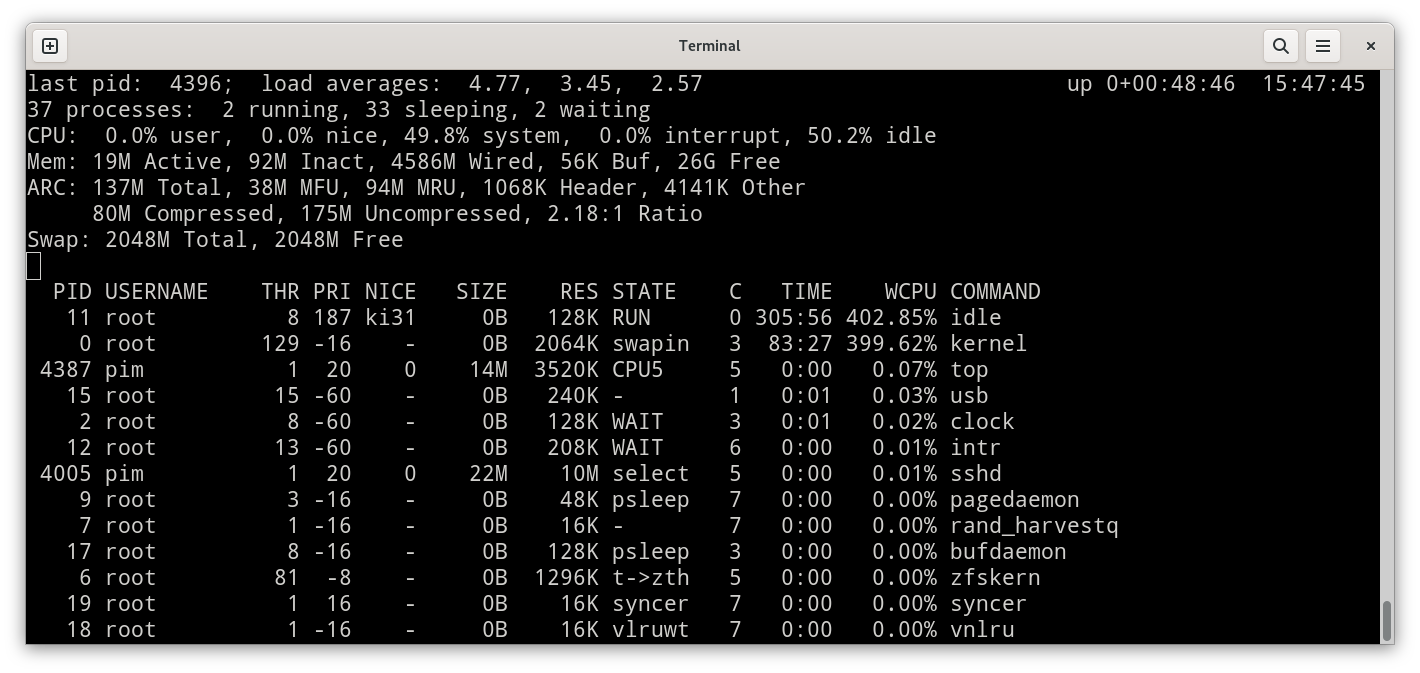
When I then do a single-flow unidirectional loadtest, the expected outcome is that only one CPU participates (100% in kernel and 700% in idle) and if I perform a single-flow bidirectional loadtest, my expectations are confirmed again, seeing two CPU threads do the work (200% in kernel and 600% in idle).
While the math checks out, the performance is a little bit less impressive:
| Type | Uni/BiDir | Packets/Sec | L2 Bits/Sec | Line Rate |
|---|---|---|---|---|
| vm=var2,size=1514 | Unidirectional | 2.02Mpps | 24.77Gbps | 99% |
| vm=var2,size=imix | Unidirectional | 3.48Mpps | 10.23Gbps | 43% |
| vm=var2,size=64 | Unidirectional | 3.61Mpps | 2.43Gbps | 9.7% |
| size=64 | Unidirectional | 1.22Mpps | 0.82Gbps | 3.2% |
| vm=var2,size=1514 | Bidirectional | 3.77Mpps | 46.31Gbps | 93% |
| vm=var2,size=imix | Bidirectional | 3.81Mpps | 11.22Gbps | 24% |
| vm=var2,size=64 | Bidirectional | 4.02Mpps | 2.69Gbps | 5.4% |
| size=64 | Bidirectional | 2.29Mpps | 1.54Gbps | 3.1% |
Conclusion: FreeBSD’s kernel on this Xeon-D1518 processor can handle about 1.2Mpps per CPU thread, and I can use only four of them. FreeBSD is happy to forward big packets, and I can reasonably reach 2x25Gbps but once I start ramping up the packets/sec by lowering the packet size, things very quickly deteriorate.
FreeBSD 14: netmap Bridge
Tom pointed out a tool in the source tree, called the netmap bridge originally written by Luigi Rizzo and Matteo Landi. FreeBSD ships the source code, but you can also take a look at their GitHub repository [ref].
What is netmap anyway? It’s a framework for extremely fast and efficient packet I/O for userspace and kernel clients, and for Virtual Machines. It runs on FreeBSD, Linux and some versions of Windows. As an aside, my buddy Pavel from FastNetMon pointed out a blogpost from 2015 in which Cloudflare folks described a way to do DDoS mitigation on Linux using traffic classification to program the network cards to move certain offensive traffic to a dedicated hardware queue, and service that queue from a netmap client. If you’re curious (I certainly was!), you might take a look at that cool write-up [here].
I compile the code and put it to work, and the man-page tells me that I need to fiddle with the interfaces a bit. They need to be:
- set to promiscuous, which makes sense as they have to receive ethernet frames sent to MAC addresses other than their own
- turn off any hardware offloading, notably
-rxcsum -txcsum -tso4 -tso6 -lro - my user needs write permission to
/dev/netmapto bind the interfaces from userspace.
[pim@france /usr/src/tools/tools/netmap]$ make
[pim@france /usr/src/tools/tools/netmap]$ cd /usr/obj/usr/src/amd64.amd64/tools/tools/netmap
[pim@france .../tools/netmap]$ sudo ifconfig ixl0 -rxcsum -txcsum -tso4 -tso6 -lro promisc
[pim@france .../tools/netmap]$ sudo ifconfig ixl1 -rxcsum -txcsum -tso4 -tso6 -lro promisc
[pim@france .../tools/netmap]$ sudo chmod 660 /dev/netmap
[pim@france .../tools/netmap]$ ./bridge -i netmap:ixl0 -i netmap:ixl1
065.804686 main [290] ------- zerocopy supported
065.804708 main [297] Wait 4 secs for link to come up...
075.810547 main [301] Ready to go, ixl0 0x0/4 <-> ixl1 0x0/4.

I start my first loadtest, which pretty immediately fails. It’s an interesting behavior pattern which
I’ve not seen before. After staring at the problem, and reading the code of bridge.c, which is a
remarkably straight forward program, I restart the bridge utility, and traffic passes again but only
for a little while. Whoops!
I took a [screencast] in case any kind soul on freebsd-net wants to take a closer look at this:

I start a bit of trial and error in which I conclude that if I send a lot of traffic (like 10Mpps), forwarding is fine; but if I send a little traffic (like 1kpps), at some point forwarding stops alltogether. So while it’s not great, this does allow me to measure the total throughput just by sending a lot of traffic, say 30Mpps, and seeing what amount comes out the other side.
Here I go, and I’m having fun:
| Type | Uni/BiDir | Packets/Sec | L2 Bits/Sec | Line Rate |
|---|---|---|---|---|
| vm=var2,size=1514 | Unidirectional | 2.04Mpps | 24.72Gbps | 100% |
| vm=var2,size=imix | Unidirectional | 8.16Mpps | 23.76Gbps | 100% |
| vm=var2,size=64 | Unidirectional | 10.83Mpps | 5.55Gbps | 29% |
| size=64 | Unidirectional | 11.42Mpps | 5.83Gbps | 31% |
| vm=var2,size=1514 | Bidirectional | 3.91Mpps | 47.27Gbps | 96% |
| vm=var2,size=imix | Bidirectional | 11.31Mpps | 32.74Gbps | 77% |
| vm=var2,size=64 | Bidirectional | 11.39Mpps | 5.83Gbps | 15% |
| size=64 | Bidirectional | 11.57Mpps | 5.93Gbps | 16% |
Conclusion: FreeBSD’s netmap implementation is also bound by packets/sec, and in this setup, the Xeon-D1518 machine is capable of forwarding roughly 11.2Mpps. What I find cool is that single flow or multiple flows doesn’t seem to matter that much, in fact bidirectional 64b single flow loadtest was most favorable at 11.57Mpps, which is an order of magnitude better than using just the kernel (which clocked in at 1.2Mpps).
FreeBSD 14: VPP with netmap
It’s good to have a baseline on this machine on how the FreeBSD kernel itself performs. But of course this series is about Vector Packet Processing, so I now turn my attention to the VPP branch that Tom shared with me. I wrote a bunch of details about the VM and bare metal install in my [first article] so I’ll just go straight to the configuration parts:
DBGvpp# create netmap name ixl0
DBGvpp# create netmap name ixl1
DBGvpp# set int state netmap-ixl0 up
DBGvpp# set int state netmap-ixl1 up
DBGvpp# set int l2 xconnect netmap-ixl0 netmap-ixl1
DBGvpp# set int l2 xconnect netmap-ixl1 netmap-ixl0

DBGvpp# show int
    Name       Idx    State  MTU (L3/IP4/IP6/MPLS)   Counter      Count
local0         0     down          0/0/0/0
netmap-ixl0    1      up          9000/0/0/0     rx packets       25622
                                                 rx bytes       1537320
                                                 tx packets       25437
                                                 tx bytes       1526220
netmap-ixl1    2      up          9000/0/0/0     rx packets       25437
                                                 rx bytes       1526220
                                                 tx packets       25622
                                                 tx bytes       1537320
At this point I can pretty much rule out that the netmap bridge.c is the issue, because a
few seconds after introducing 10Kpps of traffic and seeing it successfully pass, the loadtester
receives no more packets, even though T-Rex is still sending it. However, about a minute later
I can also see the RX and TX counters continue to increase in the VPP dataplane:
DBGvpp# show int
    Name       Idx    State  MTU (L3/IP4/IP6/MPLS)   Counter      Count
local0         0     down          0/0/0/0
netmap-ixl0    1      up          9000/0/0/0     rx packets      515843
                                                 rx bytes      30950580
                                                 tx packets      515657
                                                 tx bytes      30939420
netmap-ixl1    2      up          9000/0/0/0     rx packets      515657
                                                 rx bytes      30939420
                                                 tx packets      515843
                                                 tx bytes      30950580
.. and I can see that every packet that VPP received is accounted for: interface ixl0 has received
515843 packets, and ixl1 claims to have transmitted exactly that amount of packets. So I think
perhaps they are getting lost somewhere on egress between the kernel and the Intel i710-XXV network
card.
However, counter to the previous case, I cannot sustain any reasonable amount of traffic, be it 1Kpps, 10Kpps or 10Mpps, the system pretty consistently comes to a halt mere seconds after introducing the load. Restarting VPP makes it forward traffic again for a few seconds, just to end up in the same upset state. I don’t learn much.
Conclusion: This setup with VPP using netmap does not yield results, for the moment. I have a suspicion that whatever the cause is of the netmap bridge in the previous test, is likely also the culprit for this test.
FreeBSD 14: VPP with DPDK
But not all is lost - I have one test left, and judging by what I learned last week when bringing up
the first test environment, this one is going to be a fair bit better. In my previous loadtests, the
network interfaces were on their usual kernel driver (ixl(4) in the case of the Intel i710-XXV
interfaces), but now I’m going to mix it up a little, and rebind these interfaces to a specific DPDK
driver called nic_uio(4) which stands for Network Interface Card Userspace Input/Output:
[pim@france ~]$ cat < EOF | sudo tee -a /boot/loader.conf
nic_uio_load="YES"
hw.nic_uio.bdfs="6:0:0,6:0:1"
EOF
After I reboot, the network interfaces are gone from the output of ifconfig(8), which is good. I
start up VPP with a minimal config file [ref], which defines
three worker threads and starts DPDK with 3 RX queues and 4 TX queues. It’s a common question why
there would be one more TX queue. The explanation is that in VPP, there is one (1) main thread and
zero or more worker threads. If the main thread wants to send traffic (for example, in a plugin
like LLDP which sends periodic announcements), it would be most efficient to use a transmit queue
specific to that main thread. Any return traffic will be picked up by the DPDK Process on worker
threads (as main does not have one of these). That’s why the general rule num(TX) = num(RX)+1.
[pim@france ~/src/vpp]$ export STARTUP_CONF=/home/pim/src/startup.conf
[pim@france ~/src/vpp]$ gmake run-release

vpp# set int l2 xconnect TwentyFiveGigabitEthernet6/0/0 TwentyFiveGigabitEthernet6/0/1
vpp# set int l2 xconnect TwentyFiveGigabitEthernet6/0/1 TwentyFiveGigabitEthernet6/0/0
vpp# set int state TwentyFiveGigabitEthernet6/0/0 up
vpp# set int state TwentyFiveGigabitEthernet6/0/1 up
vpp# show int
              Name               Idx    State  MTU (L3/IP4/IP6/MPLS)     Counter          Count
TwentyFiveGigabitEthernet6/0/0    1      up          9000/0/0/0     rx packets           11615035382
                                                                    rx bytes           1785998048960
                                                                    tx packets             700076496
                                                                    tx bytes            161043604594
TwentyFiveGigabitEthernet6/0/1    2      up          9000/0/0/0     rx packets             700076542
                                                                    rx bytes            161043674054
                                                                    tx packets           11615035440
                                                                    tx bytes           1785998136540
local0                            0     down          0/0/0/0
And with that, the dataplane shoots to life and starts forwarding (lots of) packets. To my great relief, sending either 1kpps or 1Mpps “just works”. I can run my loadtest as per normal, first with 1514 byte packets, then imix, then 64 byte packets, and finally single-flow 64 byte packets. And of course, both unidirectionally and bidirectionally.
I take a look at the system load while the loadtests are running:
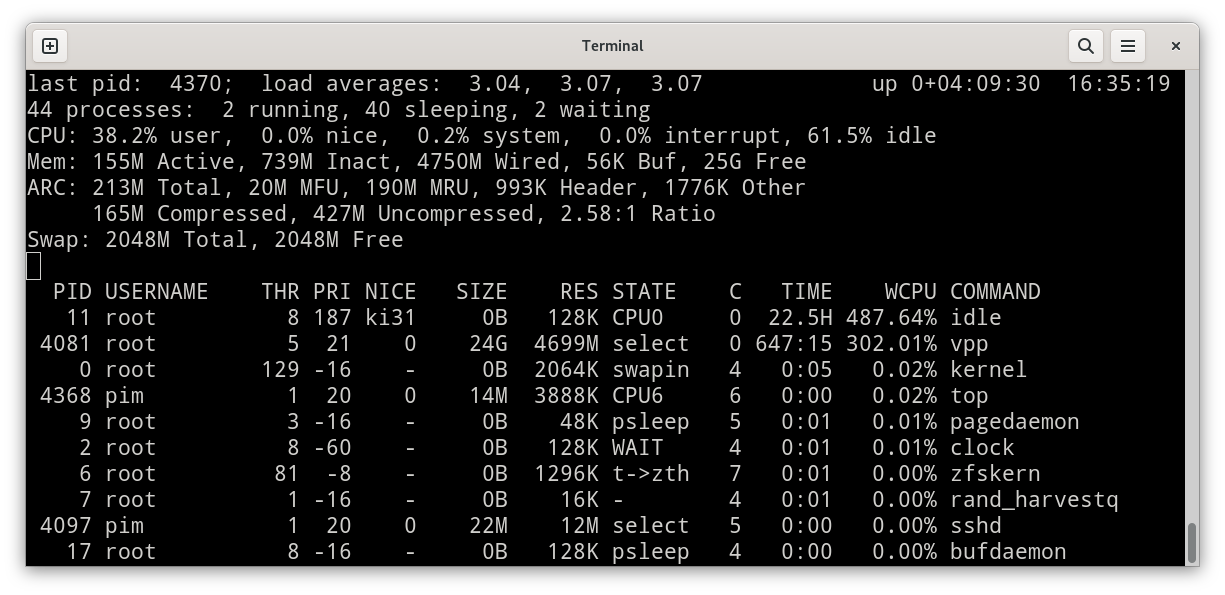
It is fully expected that the VPP process is spinning 300% +epsilon of CPU time. This is because it has started three worker threads, and these are execuing the DPDK Poll Mode Driver which is essentially a tight loop that asks the network cards for work, and if there are any packets arriving, executes on that work. As such, each worker thread is always burning 100% of its assigned CPU.
That said, I can take a look at finer grained statistics in the dataplane itself:
vpp# show run
Thread 0 vpp_main (lcore 0)
Time .9, 10 sec internal node vector rate 0.00 loops/sec 297041.19
  vector rates in 0.0000e0, out 0.0000e0, drop 0.0000e0, punt 0.0000e0
             Name                 State         Calls   Vectors   Suspends   Clocks  Vectors/Call
ip4-full-reassembly-expire-wal  any wait            0         0         18   2.39e3          0.00
ip6-full-reassembly-expire-wal  any wait            0         0         18   3.08e3          0.00
unix-cli-process-0               active             0         0          9   7.62e4          0.00
unix-epoll-input                 polling        13066         0          0   1.50e5          0.00
---------------
Thread 1 vpp_wk_0 (lcore 1)
Time .9, 10 sec internal node vector rate 12.38 loops/sec 1467742.01
  vector rates in 5.6294e6, out 5.6294e6, drop 0.0000e0, punt 0.0000e0
             Name                 State         Calls   Vectors   Suspends   Clocks  Vectors/Call
TwentyFiveGigabitEthernet6/0/1   active        399663   5047800          0   2.20e1         12.63
TwentyFiveGigabitEthernet6/0/1   active        399663   5047800          0   9.54e1         12.63
dpdk-input                       polling      1531252   5047800          0   1.45e2          3.29
ethernet-input                   active        399663   5047800          0   3.97e1         12.63
l2-input                         active        399663   5047800          0   2.93e1         12.63
l2-output                        active        399663   5047800          0   2.53e1         12.63
unix-epoll-input                 polling         1494         0          0   3.09e2          0.00

(et cetera)
I showed only one worker thread’s output, but there are actually three worker threads, and they are all doing similar work, because they are picking up 33% of the traffic each assigned to the three RX queues in the network card.
While the overall CPU load is 300%, here I can see a different picture. Thread 0 (the main thread)
is doing essentially ~nothing. It is polling a set of unix sockets in the node called
unix-epoll-input, but other than that, main doesn’t have much on its plate. Thread 1 however is
a worker thread, and I can see that it is busy doing work:
dpdk-input: it’s polling the NIC for work, it has been called 1.53M times, and in total it has handled just over 5.04M vectors (which are packets). So I can derive, that each time the Poll Mode Driver gives work, on average there are 3.29 vectors (packets), and each packet is taking about 145 CPU clocks.ethernet-input: The DPDK vectors are all ethernet frames coming from the loadtester. Seeing as I have cross connected all traffic from Tf6/0/0 to Tf6/0/1 and vice-versa, VPP knows that it should handle the packets in the L2 forwarding path.l2-inputis called with the (list of N) ethernet frames, which all get cross connected to the output interface, in this case Tf6/0/1.l2-outputprepares the ethernet frames for output into their egress interface.TwentyFiveGigabitEthernet6/0/1-output(Note: the name is truncated) If this were to have been L3 traffic, this would be the place where the destination MAC address is inserted into the ethernet frame, but since this is an L2 cross connect, the node simply passes the ethernet frames through to the final egress node in DPDK.TwentyFiveGigabitEthernet6/0/1-tx(Note: the name is truncated) hands them to the DPDK driver for marshalling on the wire.
Halfway through, I see that there’s an issue with the distribution of ingress traffic over the three workers, maybe you can spot it too:
---------------
Thread 1 vpp_wk_0 (lcore 1)
Time 56.7, 10 sec internal node vector rate 38.59 loops/sec 106879.84
  vector rates in 7.2982e6, out 7.2982e6, drop 0.0000e0, punt 0.0000e0
             Name                 State       Calls     Vectors  Suspends   Clocks  Vectors/Call
TwentyFiveGigabitEthernet6/0/0   active     6689553   206899956         0   1.34e1         30.93
TwentyFiveGigabitEthernet6/0/0   active     6689553   206899956         0   1.37e2         30.93
TwentyFiveGigabitEthernet6/0/1   active     6688572   206902836         0   1.45e1         30.93
TwentyFiveGigabitEthernet6/0/1   active     6688572   206902836         0   1.34e2         30.93
dpdk-input                       polling    7128012   413802792         0   8.77e1         58.05
ethernet-input                   active    13378125   413802792         0   2.77e1         30.93
l2-input                         active     6809002   413802792         0   1.81e1         60.77
l2-output                        active     6809002   413802792         0   1.68e1         60.77
unix-epoll-input                 polling       6954           0         0   6.61e2          0.00
---------------
Thread 2 vpp_wk_1 (lcore 2)
Time 56.7, 10 sec internal node vector rate 256.00 loops/sec 7702.68
  vector rates in 4.1188e6, out 4.1188e6, drop 0.0000e0, punt 0.0000e0
             Name                 State       Calls     Vectors  Suspends   Clocks  Vectors/Call
TwentyFiveGigabitEthernet6/0/0   active      456112   116764672         0   1.27e1        256.00
TwentyFiveGigabitEthernet6/0/0   active      456112   116764672         0   2.64e2        256.00
TwentyFiveGigabitEthernet6/0/1   active      456112   116764672         0   1.39e1        256.00
TwentyFiveGigabitEthernet6/0/1   active      456112   116764672         0   2.74e2        256.00
dpdk-input                       polling     456112   233529344         0   1.41e2        512.00
ethernet-input                   active      912224   233529344         0   5.71e1        256.00
l2-input                         active      912224   233529344         0   3.66e1        256.00
l2-output                        active      912224   233529344         0   1.70e1        256.00
unix-epoll-input                 polling        445           0         0   9.59e2          0.00
---------------
Thread 3 vpp_wk_2 (lcore 3)
Time 56.7, 10 sec internal node vector rate 256.00 loops/sec 7742.43
  vector rates in 4.1188e6, out 4.1188e6, drop 0.0000e0, punt 0.0000e0
             Name                 State       Calls     Vectors  Suspends  Clocks  Vectors/Call
TwentyFiveGigabitEthernet6/0/0   active      456113   116764928         0  8.94e0        256.00
TwentyFiveGigabitEthernet6/0/0   active      456113   116764928         0  2.81e2        256.00
TwentyFiveGigabitEthernet6/0/1   active      456113   116764928         0  9.54e0        256.00
TwentyFiveGigabitEthernet6/0/1   active      456113   116764928         0  2.72e2        256.00
dpdk-input                       polling     456113   233529856         0  1.61e2        512.00
ethernet-input                   active      912226   233529856         0  4.50e1        256.00
l2-input                         active      912226   233529856         0  2.93e1        256.00
l2-output                        active      912226   233529856         0  1.23e1        256.00
unix-epoll-input                 polling        445           0         0  1.03e3          0.00
Thread 1 (vpp_wk_0) is handling 7.29Mpps and moderately loaded, while Thread 2 and 3 are handling
each 4.11Mpps and are completely pegged. That said, the relative amount of CPU clocks they are
spending per packet is reasonably similar, but they don’t quite add up:
- Thread 1 is doing 7.29Mpps and is spending on average 449 CPU cycles per packet. I get this
number by adding up all of the values in the Clocks column, except for the
unix-epoll-inputnode. But that’s somewhat strange, because this Xeon D1518 clocks at 2.2GHz – and yet 7.29M * 449 is 3.27GHz. My experience (in Linux) is that these numbers actually line up quite well. - Thread 2 is doing 4.12Mpps and is spending on average 816 CPU cycles per packet. This kind of makes sense as the cycles/packet is roughly double that of thread 1, and the packet/sec is roughly half … and the total of 4.12M * 816 is 3.36GHz.
- I can see similarly values for thread 3: 4.12Mpps and also 819 CPU cycles per packet which amounts to VPP self-reporting using 3.37GHz worth of cycles on this thread.
When I look at the thread to CPU placement, I get another surprise:
vpp# show threads
ID     Name                Type        LWP     Sched Policy (Priority)  lcore  Core   Socket State
0      vpp_main                        100346  (nil) (n/a)              0      42949674294967
1      vpp_wk_0            workers     100473  (nil) (n/a)              1      42949674294967
2      vpp_wk_1            workers     100474  (nil) (n/a)              2      42949674294967
3      vpp_wk_2            workers     100475  (nil) (n/a)              3      42949674294967

vpp# show cpu
Model name:               Intel(R) Xeon(R) CPU D-1518 @ 2.20GHz
Microarch model (family): [0x6] Broadwell ([0x56] Broadwell DE) stepping 0x3
Flags:                    sse3 pclmulqdq ssse3 sse41 sse42 avx rdrand avx2 bmi2 rtm pqm pqe
                          rdseed aes invariant_tsc
Base frequency:           2.19 GHz
The numbers in show threads are all messed up, and I don’t quite know what to make of it yet. I
think the perhaps overly specific Linux implementation of the thread pool management is throwing off
FreeBSD a bit. Perhaps some profiling could be useful, so I make a note to discuss this with Tom or
the freebsd-net mailing list, who will know a fair bit more about this type of stuff on FreeBSD than
I do.
Anyway, functionally: this works. Performance wise: I have some questions :-) I let all eight loadtests complete and without further ado, here’s the results:
| Type | Uni/BiDir | Packets/Sec | L2 Bits/Sec | Line Rate |
|---|---|---|---|---|
| vm=var2,size=1514 | Unidirectional | 2.01Mpps | 24.45Gbps | 99% |
| vm=var2,size=imix | Unidirectional | 8.07Mpps | 23.42Gbps | 99% |
| vm=var2,size=64 | Unidirectional | 23.93Mpps | 12.25Gbps | 64% |
| size=64 | Unidirectional | 12.80Mpps | 6.56Gbps | 34% |
| vm=var2,size=1514 | Bidirectional | 3.91Mpps | 47.35Gbps | 86% |
| vm=var2,size=imix | Bidirectional | 13.38Mpps | 38.81Gbps | 82% |
| vm=var2,size=64 | Bidirectional | 15.56Mpps | 7.97Gbps | 21% |
| size=64 | Bidirectional | 20.96Mpps | 10.73Gbps | 28% |
Conclusion: I have to say: 12.8Mpps on a unidirectional 64b single-flow loadtest (thereby only being able to make use of one DPDK worker), and 20.96Mpps on a bidirectional 64b single-flow loadtest, is not too shabby. But seeing as one CPU thread can do 12.8Mpps, I would imagine that three CPU threads would perform at 38.4Mpps or there-abouts, but I’m seeing only 23.9Mpps and some unexplained variance in per-thread performance.
Results
I learned a lot! Some hilights:
- The netmap implementation is not playing ball for the moment, as forwarding stops consistently, in
both the
bridge.cas well as the VPP plugin. - It is clear though, that netmap is a fair bit faster (11.4Mpps) than kernel forwarding which came in at roughly 1.2Mpps per CPU thread. What’s a bit troubling is that netmap doesn’t seem to work very well in VPP – traffic forwarding also stops here.
- DPDK performs quite well on FreeBSD, I manage to see a throughput of 20.96Mpps which is almost
twice the throughput of netmap, which is cool but I can’t quite explain the stark variance
in throughput between the worker threads. Perhaps VPP is placing the workers on hyperthreads?
Perhaps an equivalent of
isolcpusin the Linux kernel would help?
For the curious, I’ve bundled up a few files that describe the machine and its setup: [dmesg] [pciconf] [loader.conf] [VPP startup.conf]