Mastodon - Part 2 - Monitoring
About this series
![]()
I have seen companies achieve great successes in the space of consumer internet and entertainment industry. I’ve been feeling less enthusiastic about the stronghold that these corporations have over my digital presence. I am the first to admit that using “free” services is convenient, but these companies are sometimes taking away my autonomy and exerting control over society. To each their own of course, but for me it’s time to take back a little bit of responsibility for my online social presence, away from centrally hosted services and to privately operated ones.
In the [previous post], I shared some thoughts on how the overall install of a Mastodon instance went, making it a point to ensure my users’ (and my own!) data is somehow safe, and the machine runs on good hardware, and with good connectivity. Thanks IPng, for that 10G connection! In this post, I visit an old friend, [Borgmon], which has since reincarnated and become the de facto open source observability and signals ecosystem, and its incomparably awesome friend. Hello, Prometheus and Grafana!
Anatomy of Mastodon
Looking more closely at the architecture of Mastodon, it consists of a few moving parts:
- Storage: At the bottom, there’s persistent storage, in my case ZFS, on which account information (like avatars), media attachments, and site-specific media lives. As posts stream to my instance, their media is spooled locally for performance.
- State: Application state is kept in two databases:
- Firstly, a SQL database which is chosen to be [PostgreSQL].
- Secondly, a memory based key-value storage system [Redis] is used to track the vitals of home feeds, list feeds, Sidekiq queues as well as Mastodon’s streaming API.
- Web (transactional): The webserver that serves end user requests and the API is written in a Ruby framework called [Puma]. Puma tries to do its job efficiently, and doesn’t allow itself to be bogged down by long lived web sessions, such as the ones where clients get streaming updates to their timelines on the web- or mobile client.
- Web (streaming): This webserver is written in [NodeJS] and excels at long lived connections that use Websockets, by providing a Streaming API to clients.
- Web (frontend): To tie all the current and future microservices together, provide SSL (for HTTPS), and a local object cache for things that don’t change often, one or more [NGINX] servers are used.
- Backend (processing): Many interactions with the server (such as distributing posts) turn in to background tasks that are enqueued and handled asynchronously by a worker pool provided by [Sidekiq].
- Backend (search): Users that wish to search the local corpus of posts and media, can interact with an instance of [Elastic], a free and open search and analytics solution.
These systems all interact in particular ways, but I immediately noticed one interesting tidbit. Pretty much every system in this list can (or can be easily made to) emit metrics in a popular [Prometheus] format. I cannot overstate the love I have for this project, both technically but also socially because I know how it came to be. Ben, thanks for the RC racecars (I still have them!). Matt, I admire your Go- and Java-skills and your general workplace awesomeness. And Richi sorry to have missed you last week in Hamburg at [DENOG14]!
Prometheus
Taking stock of the architecture here, I think my best bet is to rig this stuff up with Prometheus. This works mostly by having a central, in my case external to [uBlog.tech] server scrape a bunch of timeseries metrics periodically, after which I can create pretty graphs of them, but also monitor if some values seem out of whack, like a Sidekiq queue delay raising, CPU or disk I/O running a bit hot. And the best thing yet? I will get pretty much all of this for free, because other, smarter folks have contributed into this ecosystem already:
- Server: monitoring is canonically done by [Node Exporter]. It provides metrics for all the lowlevel machine and kernel stats you’d ever think to want: network, disk, cpu, processes, load, and so on.
- Redis: Is provided by [Redis Exporter] and can show all sorts of operations on data realms served by Redis.
- PostgreSQL: is provided by [Postgres Exporter] which is maintained by the Prometheus Community.
- NGINX: Is provided by [NGINX Exporter] which is maintained by the company behind NGINX. I used to have a Lua based exporter (when I ran [SixXS]) which had lots of interesting additional stats, but for the time being I’ll just use this one.
- Elastic: has a converter from its own metrics system in the [Elasticsearch Exporter], once again maintained by the (impressively fabulous!) Prometheus Community.
All of these implement a common pattern: they take the (bespoke, internal) representation of statistics counters or dials/gauges, and
transform them into a common format called the Metrics Exposition format, and they provide this in either an HTTP endpoint (typically
using a /metrics URI handler directly on the webserver), or in a push-mechanism using a popular
[Pushgateway] in case there is no server to poll, for example a batch process that did
some work and wanted to report on its results.
Incidentally, a fair amount of popular open source infrastructure already has a Prometheus exporter – check out [this list], but also the assigned [TCP ports] for popular things that you might also be using. Maybe you’ll get lucky and find out that somebody has already provided an exporter, so you don’t have to!
Configuring Exporters
Now that I have found a whole swarm of these Prometheus Exporter microservices, and understand how to plumb each of them through to what-ever it is they are monitoring, I can get cracking on some observability. Let me provide some notes for posterity, both for myself if I ever revisit the topic and … kind of forgot what I had done so far :), but maybe also for the adventurous, who are interested in using Prometheus on their own Mastodon instance.
First of all, it’s worth mentioning that while these exporters (typically written in Go) have command line flags, they can often also take their configuration from environment variables, provided mostly becasue they operate in Docker or Kubernetes. My exporters will all run vanilla in systemd, but these systemd units can also be configured to use environments, which is neat!
First, I create a few environment files for each systemd unit that contains a Prometheus exporter:
pim@ublog:~$ ls -la /etc/default/*exporter
-rw-r----- 1 root root   49 Nov 23 18:15 /etc/default/elasticsearch-exporter
-rw-r----- 1 root root   76 Nov 22 17:13 /etc/default/nginx-exporter
-rw-r----- 1 root root  170 Nov 22 22:41 /etc/default/postgres-exporter
-rw-r----- 1 root root 9789 May 27  2021 /etc/default/prometheus-node-exporter
-rw-r----- 1 root root    0 Nov 22 22:56 /etc/default/redis-exporter
-rw-r----- 1 root root   67 Nov 22 23:56 /etc/default/statsd-exporter
The contents of these files will give away passwords, like the one for ElasticSearch or Postgres, so I specifically make them readable only
by root:root. I won’t share my passwords with you, dear reader, so you’ll have to guess the contents here!
Priming the environment with these values, I will take the systemd unit for elasticsearch as an example:
pim@ublog:~$ cat << EOF | sudo tee /lib/systemd/system/elasticsearch-exporter.service
[Unit]
Description=Elasticsearch Prometheus Exporter
After=network.target

[Service]
EnvironmentFile=/etc/default/elasticsearch-exporter
ExecStart=/usr/local/bin/elasticsearch_exporter
User=elasticsearch
Group=elasticsearch
Restart=always

[Install]
WantedBy=multi-user.target
EOF

pim@ublog:~$ cat << EOF | sudo tee /etc/default/elasticsearch-exporter
ES_USERNAME=elastic
ES_PASSWORD=$(SOMETHING_SECRET) # same as ES_PASS in .env.production
EOF

pim@ublog:~$ sudo systemctl enable elasticsearch-exporter
pim@ublog:~$ sudo systemctl start elasticsearch-exporter
Et voilà, just like that the service starts, connects to elasticsearch, transforms all of its innards into beautiful Prometheus metrics, and exposes them on its “registered” port, in this case 9114, which can be scraped by the Prometheus instance a few computers away, connected to the uBlog VM via backend LAN over RFC1918. I just knew that second NIC would come in useful!
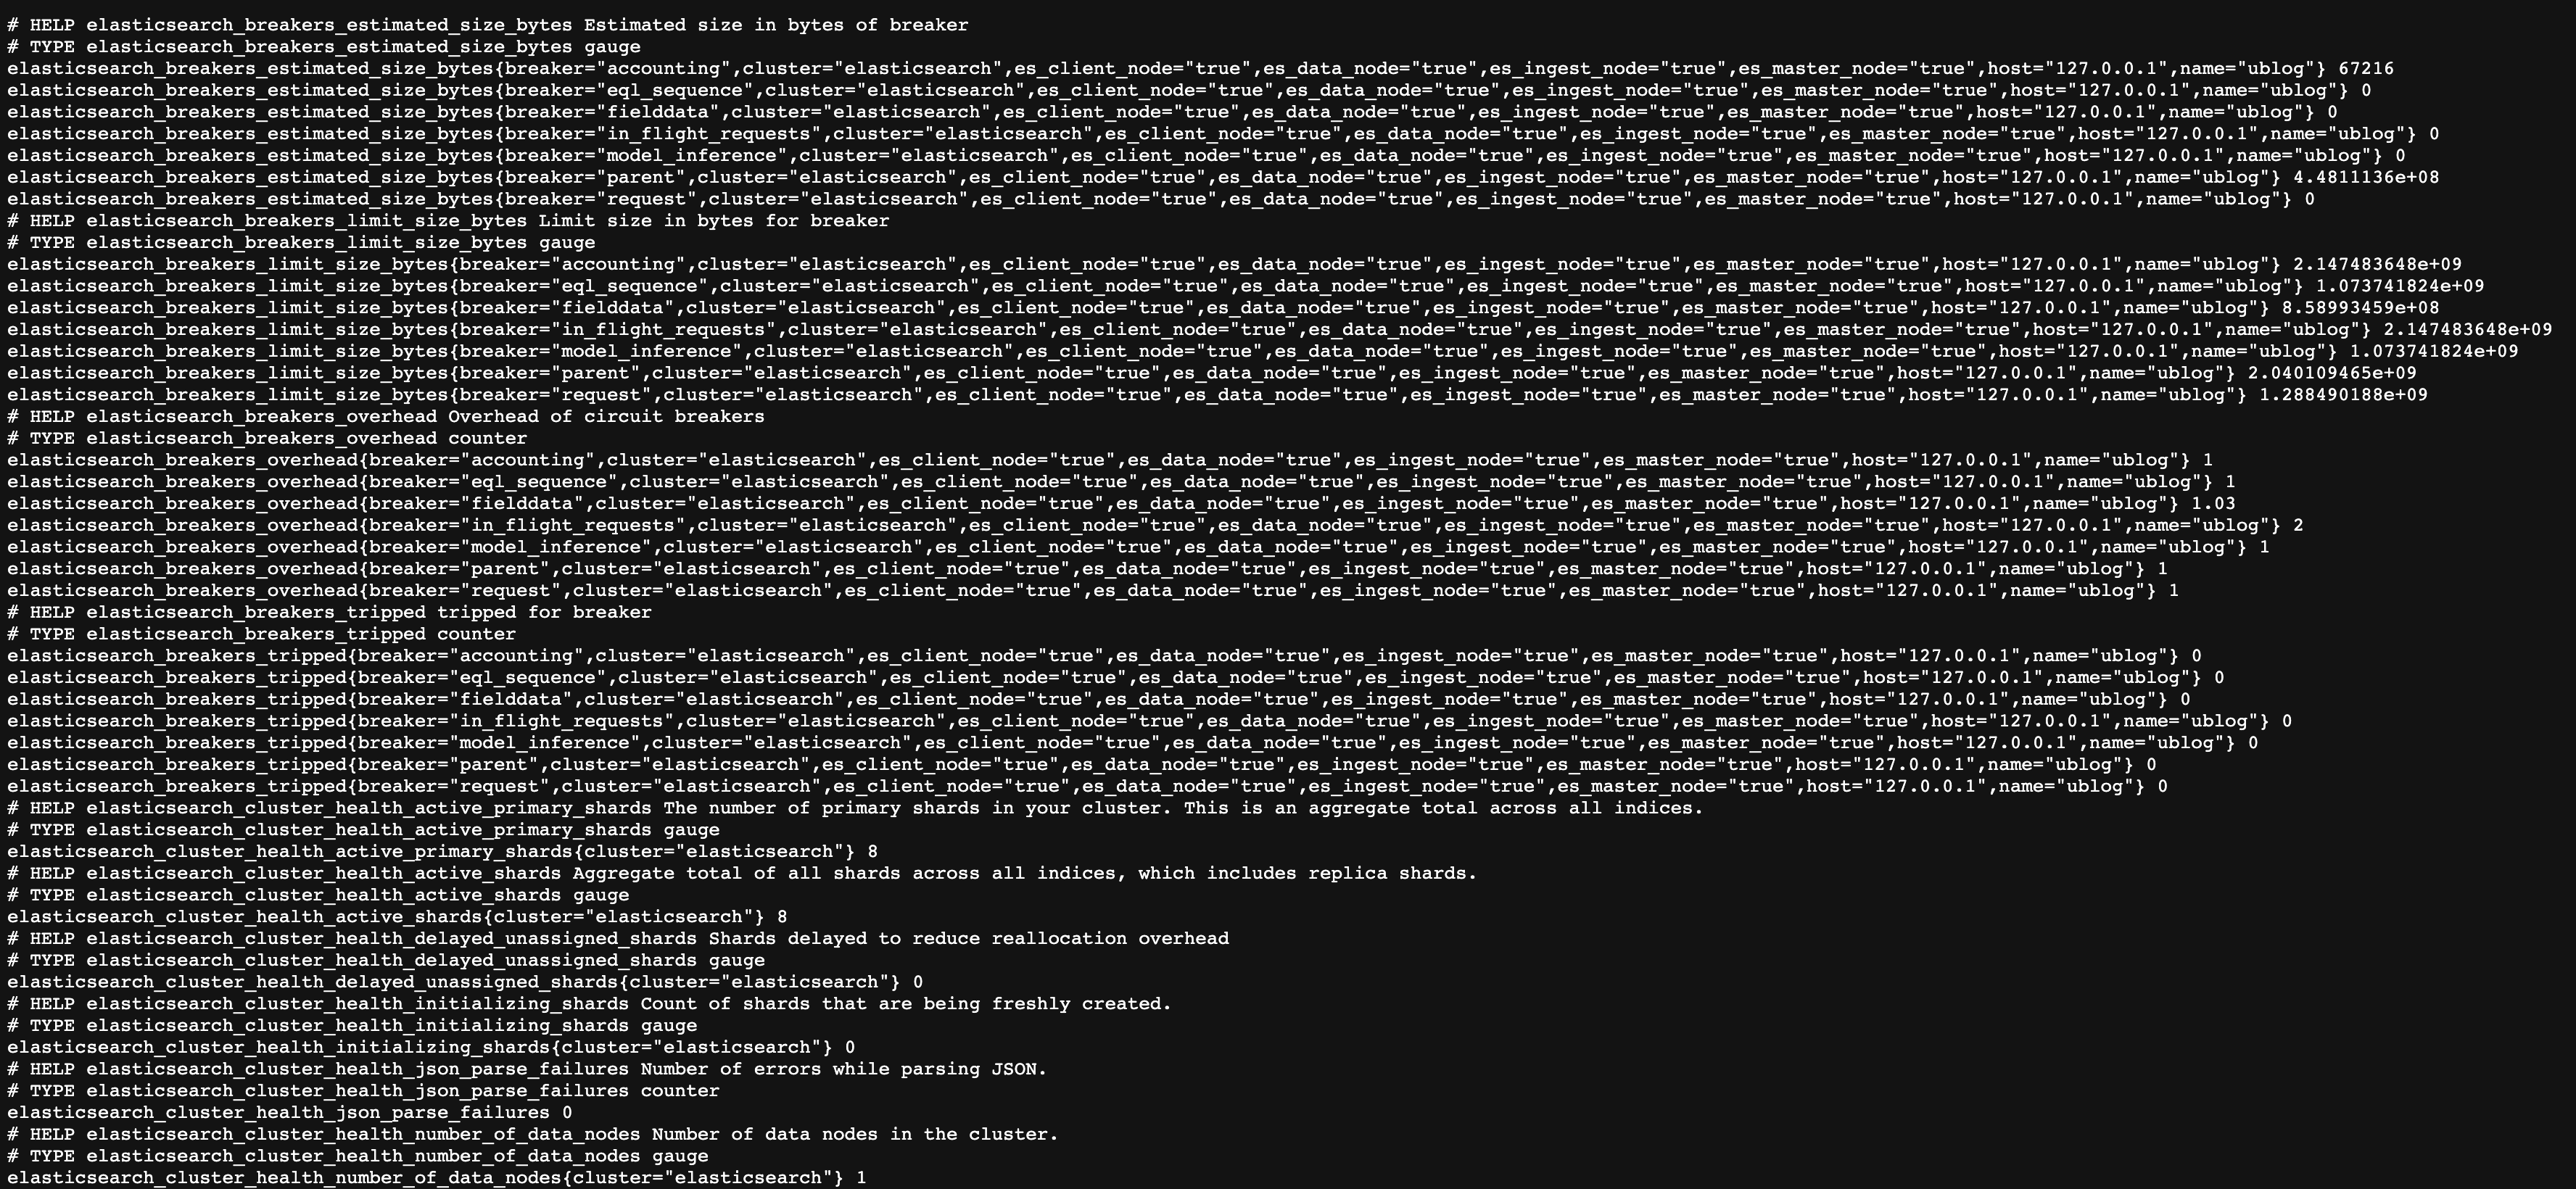
All five of the exporters are configured and exposed. They are now providing a wealth of realtime information on how the various Mastodon components are going. And if any of them start malfunctioning, or running out of steam, or simply taking the day off, I will be able to see this either by certrain metrics going out of expected ranges, or by the exporter reporting that it cannot even find the service at all (which we can also detect and turn into alarms, more on that later).
Pictured here (you should probably open it in full resolution unless you have hawk eyes), is an example of those metrics, of which Prometheus is happy to handle several million at relatively high period of scraping, in my case every 10 seconds, it comes around and pulls the data from these five exporters. While these metrics are human readable, they aren’t very practical…
Grafana
… so let’s visualize them with an equally awesome tool: [Grafana]. This tool provides operational dashboards for any
data that is stored here, there, or anywhere :) Grafana can render stuff from a plethora of backends, one popular and established one is
Prometheus. And as it turns out, as with Prometheus, lots of work has been done already with canonical, almost out-of-the-box, dashboards
that were contributed by folks in the field. n fact, every single one of the five exporters I installed, also have an accompanying
dashboard, sometimes even multiple to choose from! Grafana allows you to [search and download]
these from a corpus they provide, referring to them by their id, or alternatively downloading a JSON representation of the dashboard, for
example one that comes with the exporter, or one you find on GitHub.
For uBlog, I installed: [Node Exporter], [Postgres Exporter], [Redis Exporter], [NGINX Exporter], and [ElasticSearch Exporter].
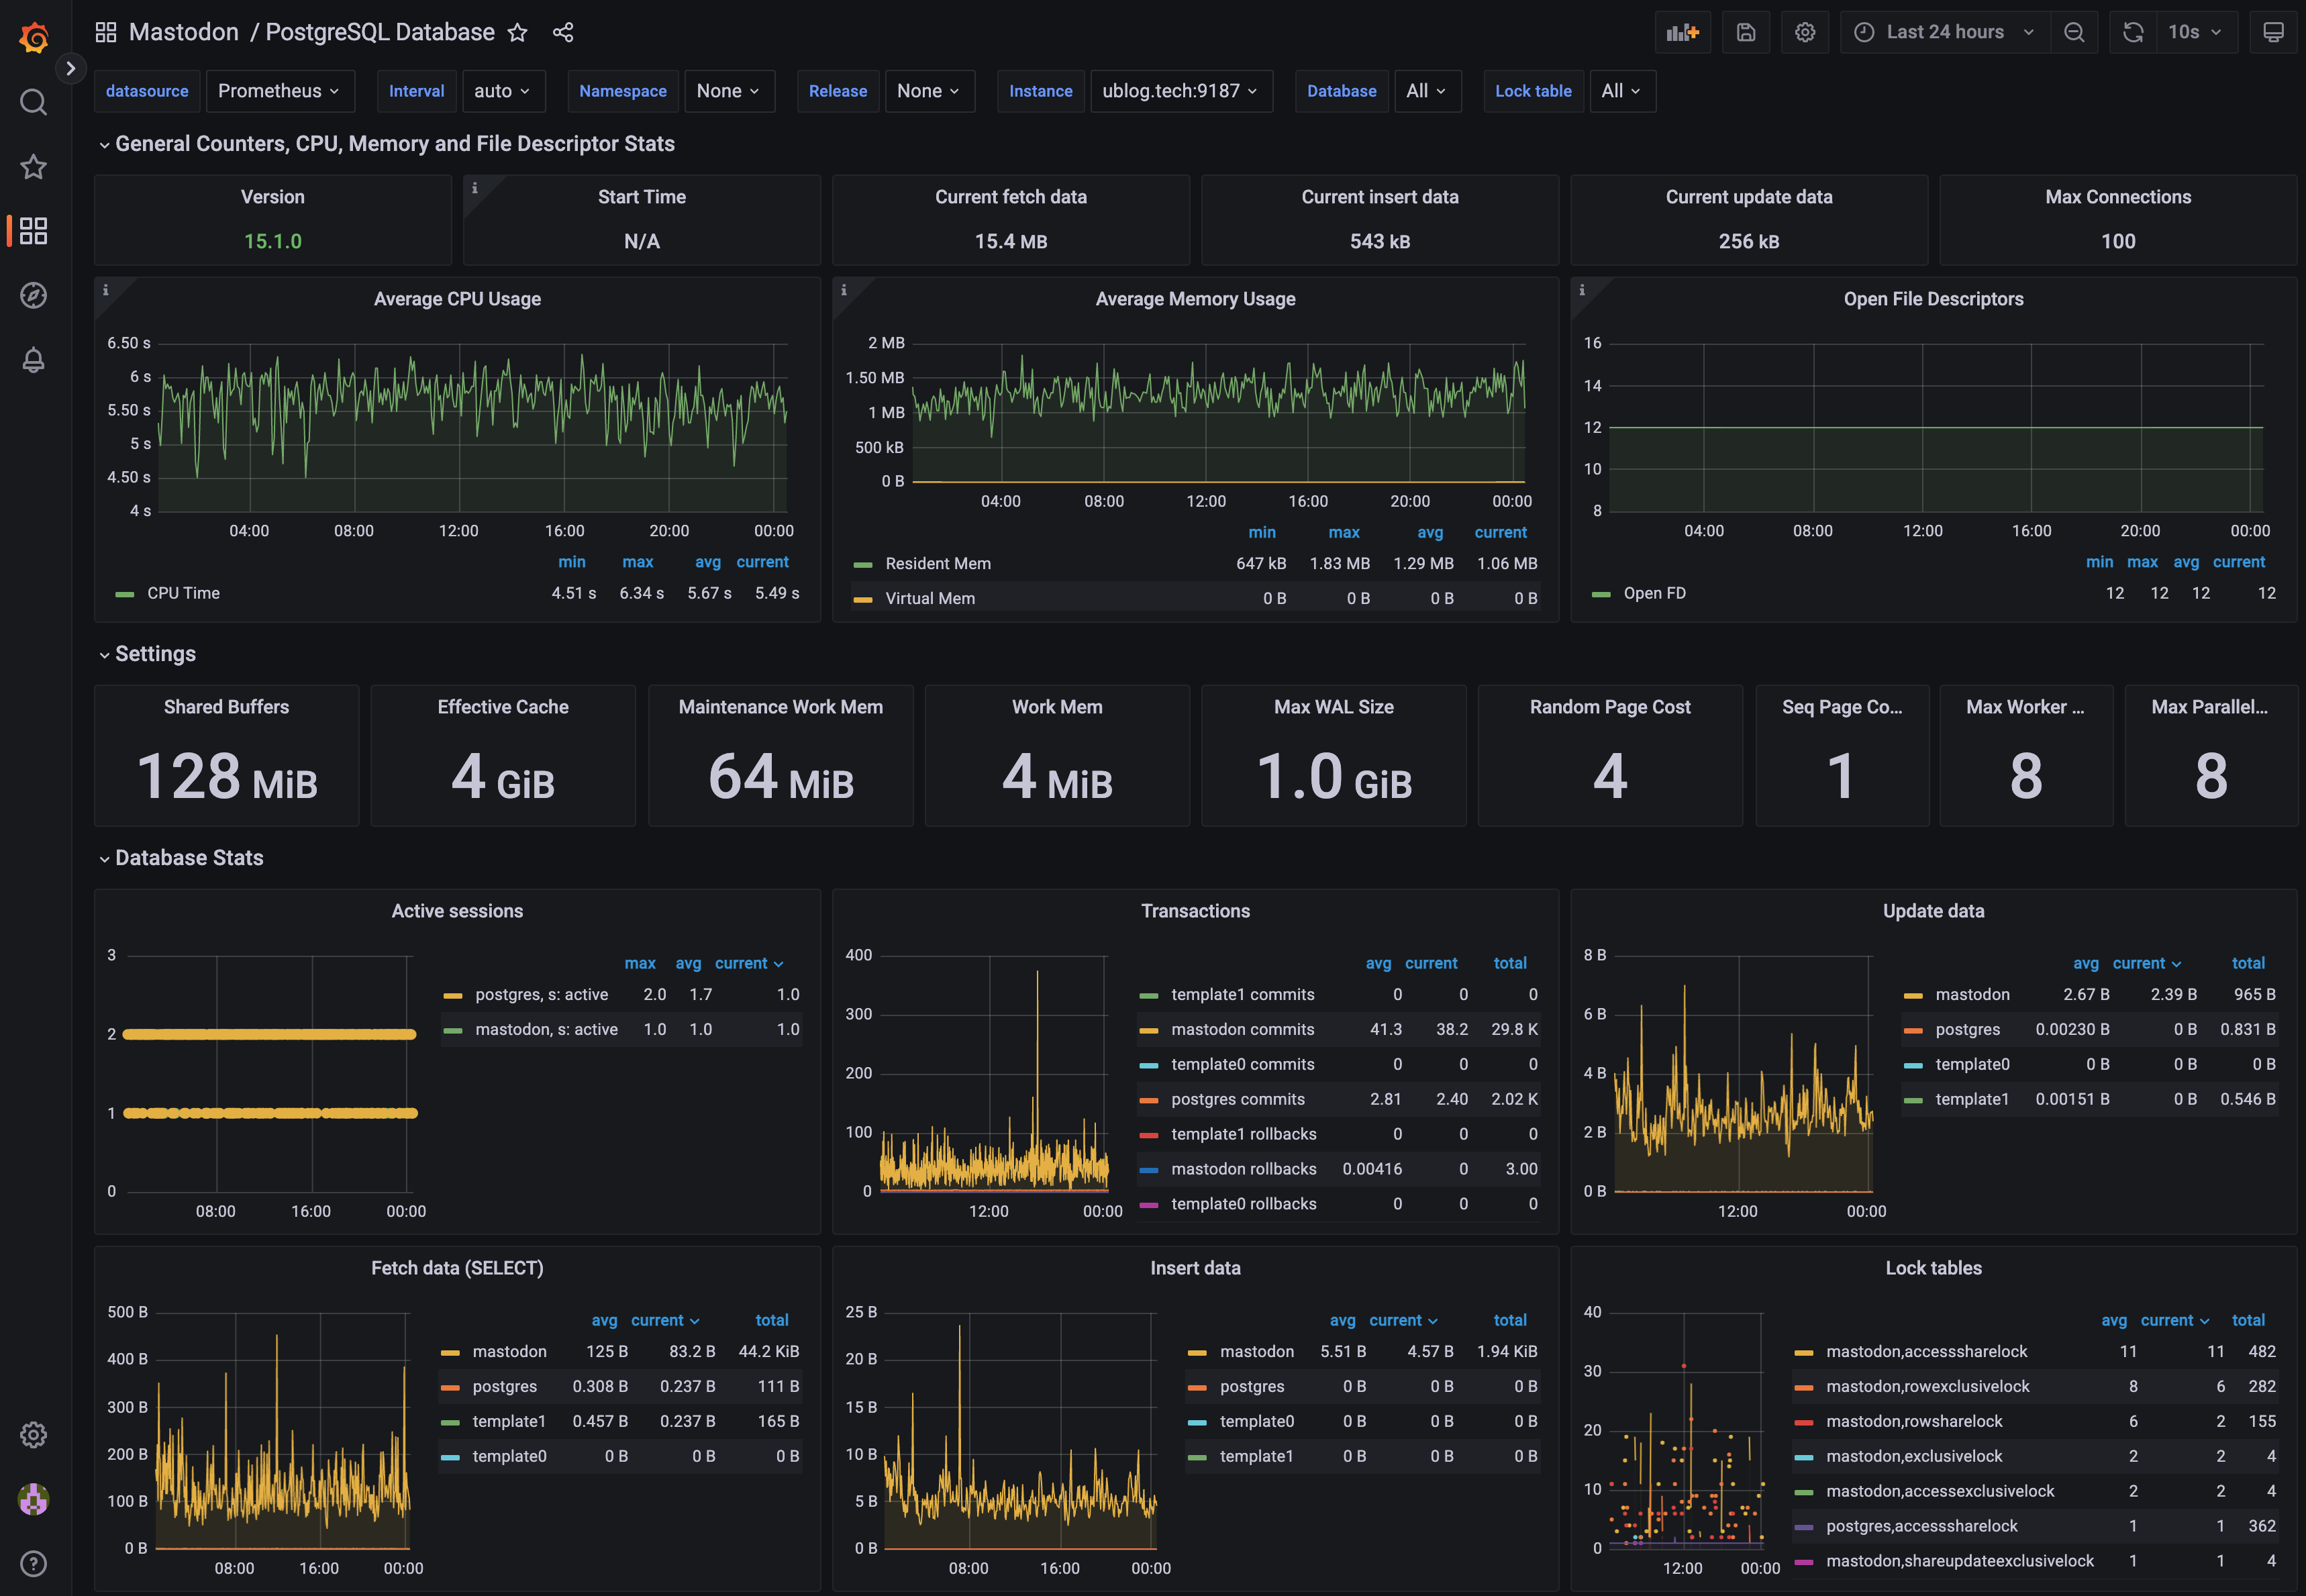
To the right (top) you’ll see a dashboard for PostgreSQL - it has lots of expert insights on how databases are used, how many read/write operations (like SELECT and UPDATE/DELETE queries) are performed, and their respective latency expectations. What I find particularly useful is the total amount of memory, CPU and disk activity. This allows me to see at a glance when it’s time to break out [pgTune] to help change system settings for Postgres, or even inform me when it’s time to move the database to its own server rather than co-habitating with the other stuff running on this virtual machine. In my experience, stateful systems are often the source of bottlenecks, so I take special care to monitor them and observe their performance over time. In particular, slowness will be seen in Mastodon if the database is slow (sound familiar?).
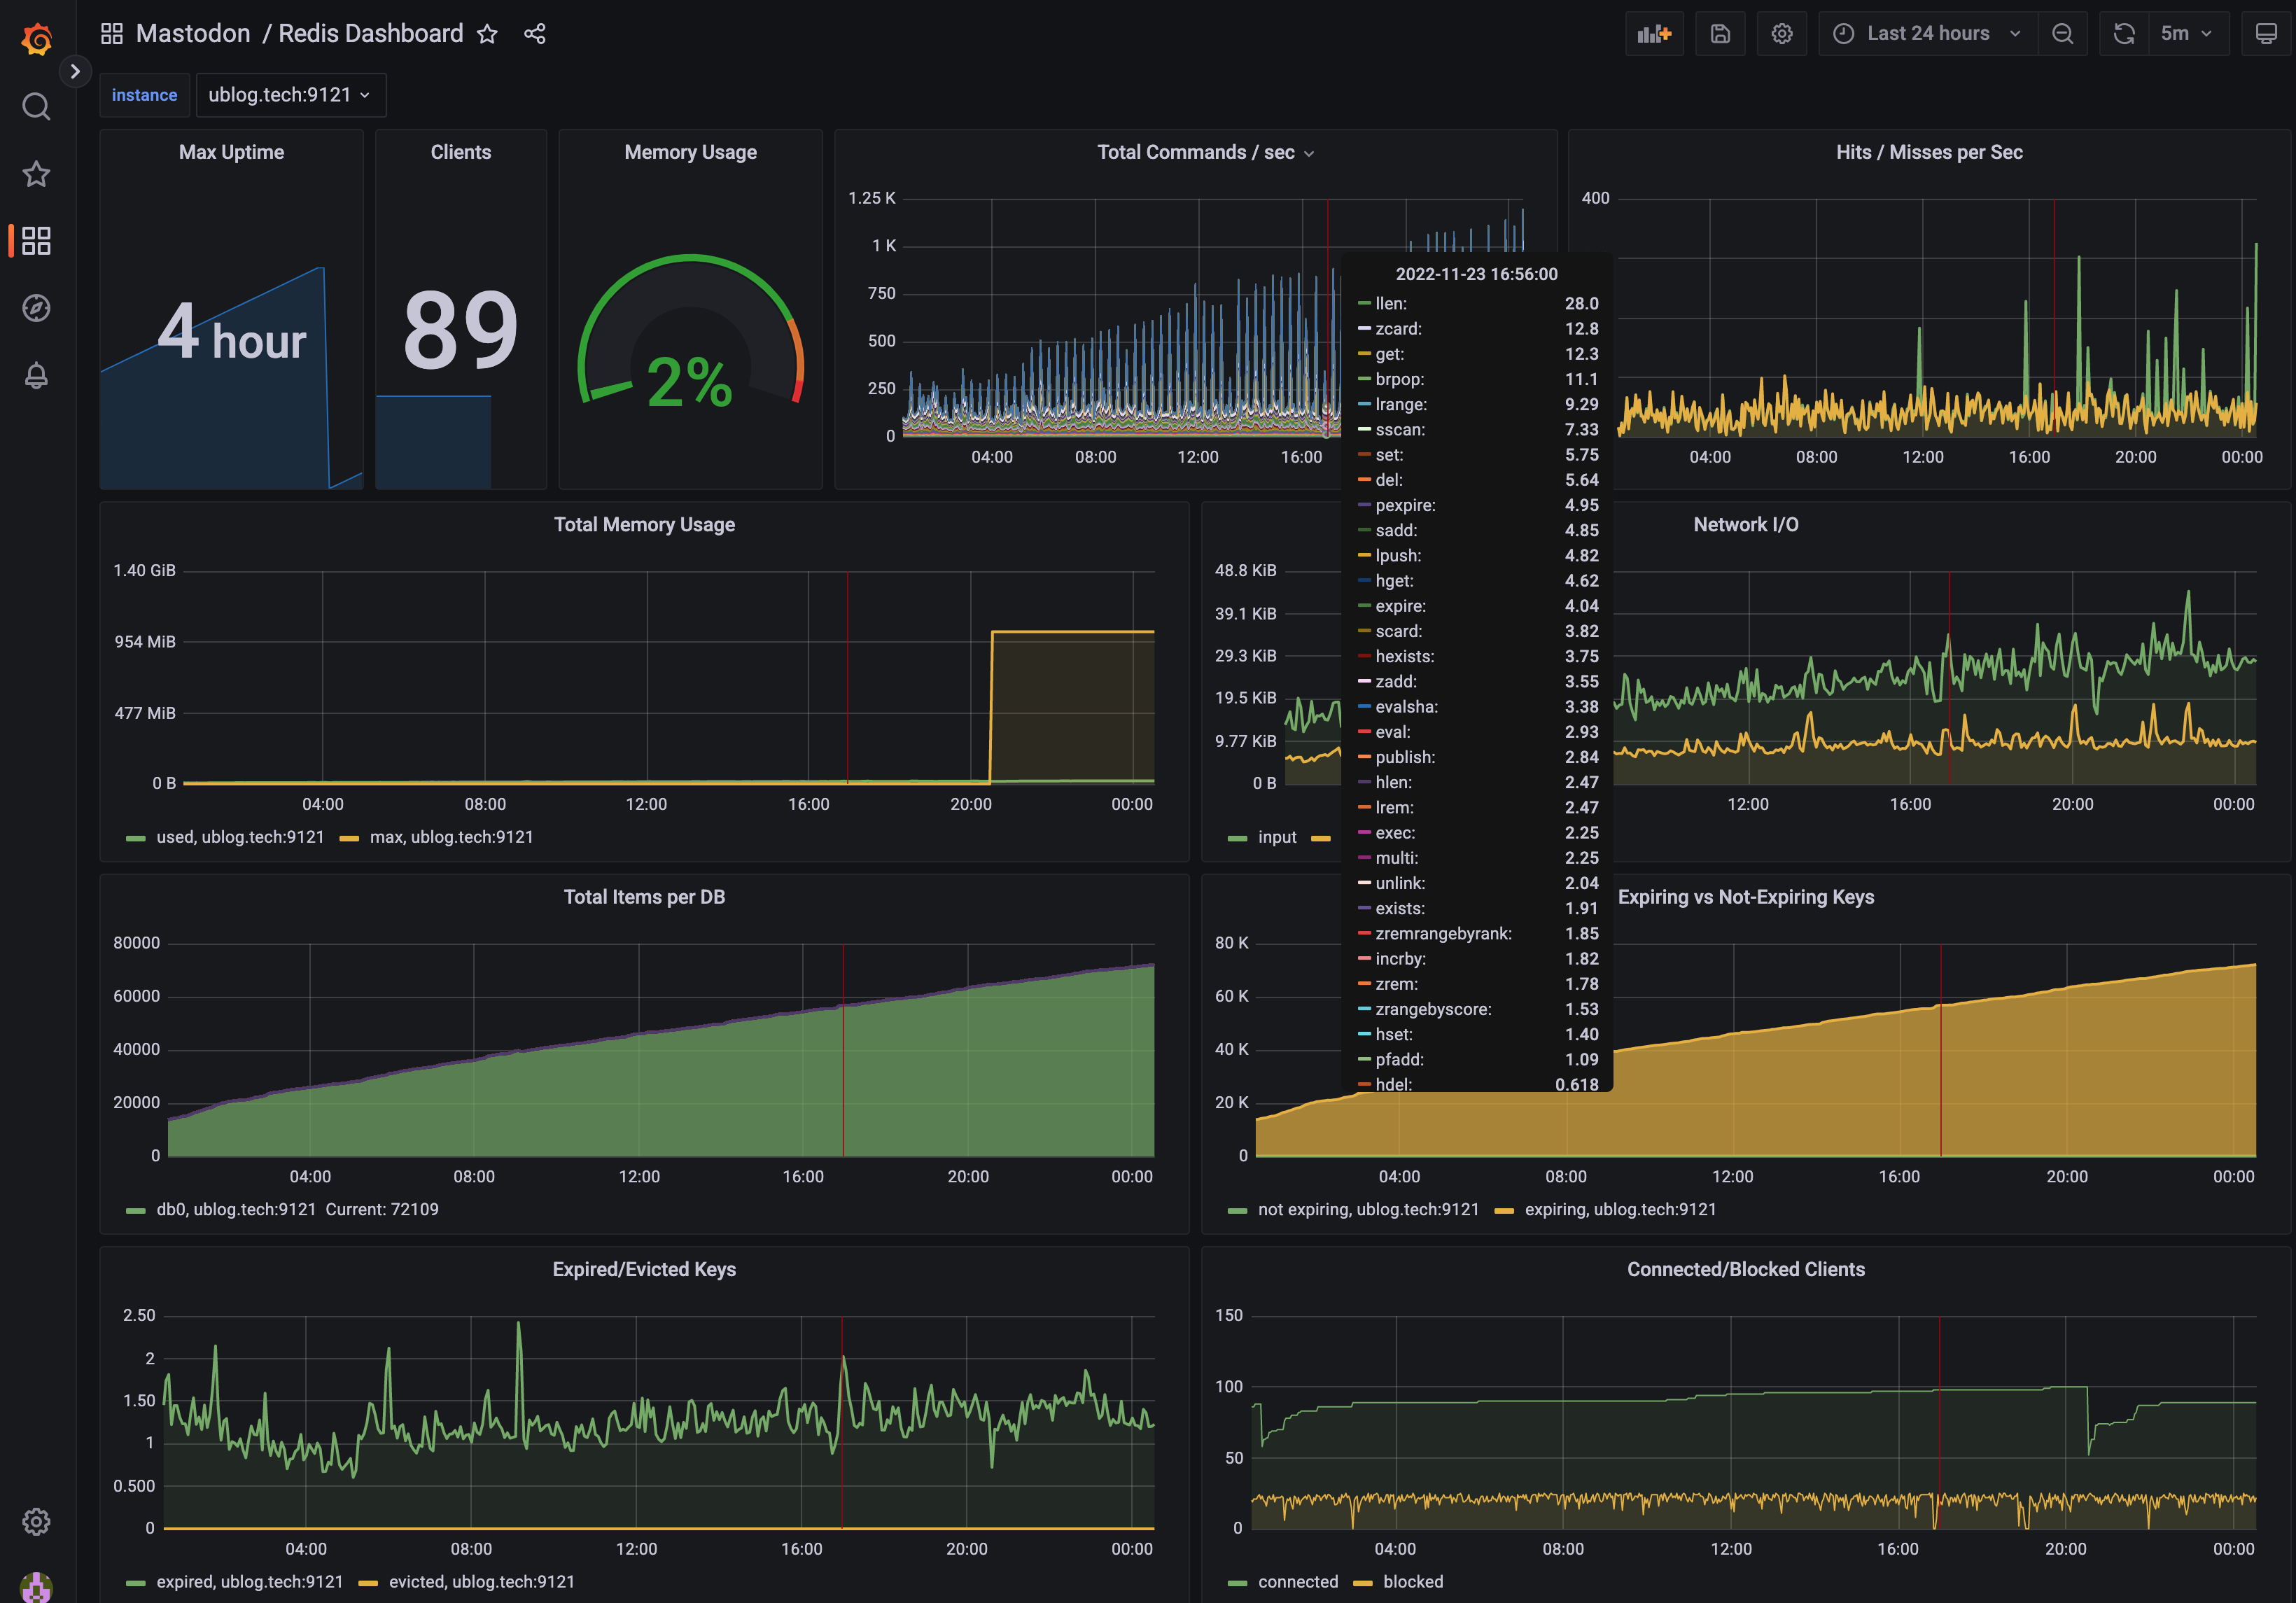
Next, to the right (middle) you’ll see a dashboard for Redis. This one shows me how full the Redis cache is (you can see the yellow line at
in the first graph there is when I restarted Redis to give it a maxmemory setting of 1GB), but also a high resolution overview of how many
operations it’s doing. I can see that the server is spiky and upon closer inspection this is the pfcount command with a period of exactly
300 seconds, in other words something is spiking every 5min. I have a feeling that this might become an issue… and when it does, I’ll get
to learn all about this elusive [pfcount] command. But until then, I can see the average time by
command: because Redis serves from RAM and this is a pretty quick server, I see the turnaround time for most queries to it in the
200-500 µs range, wow!
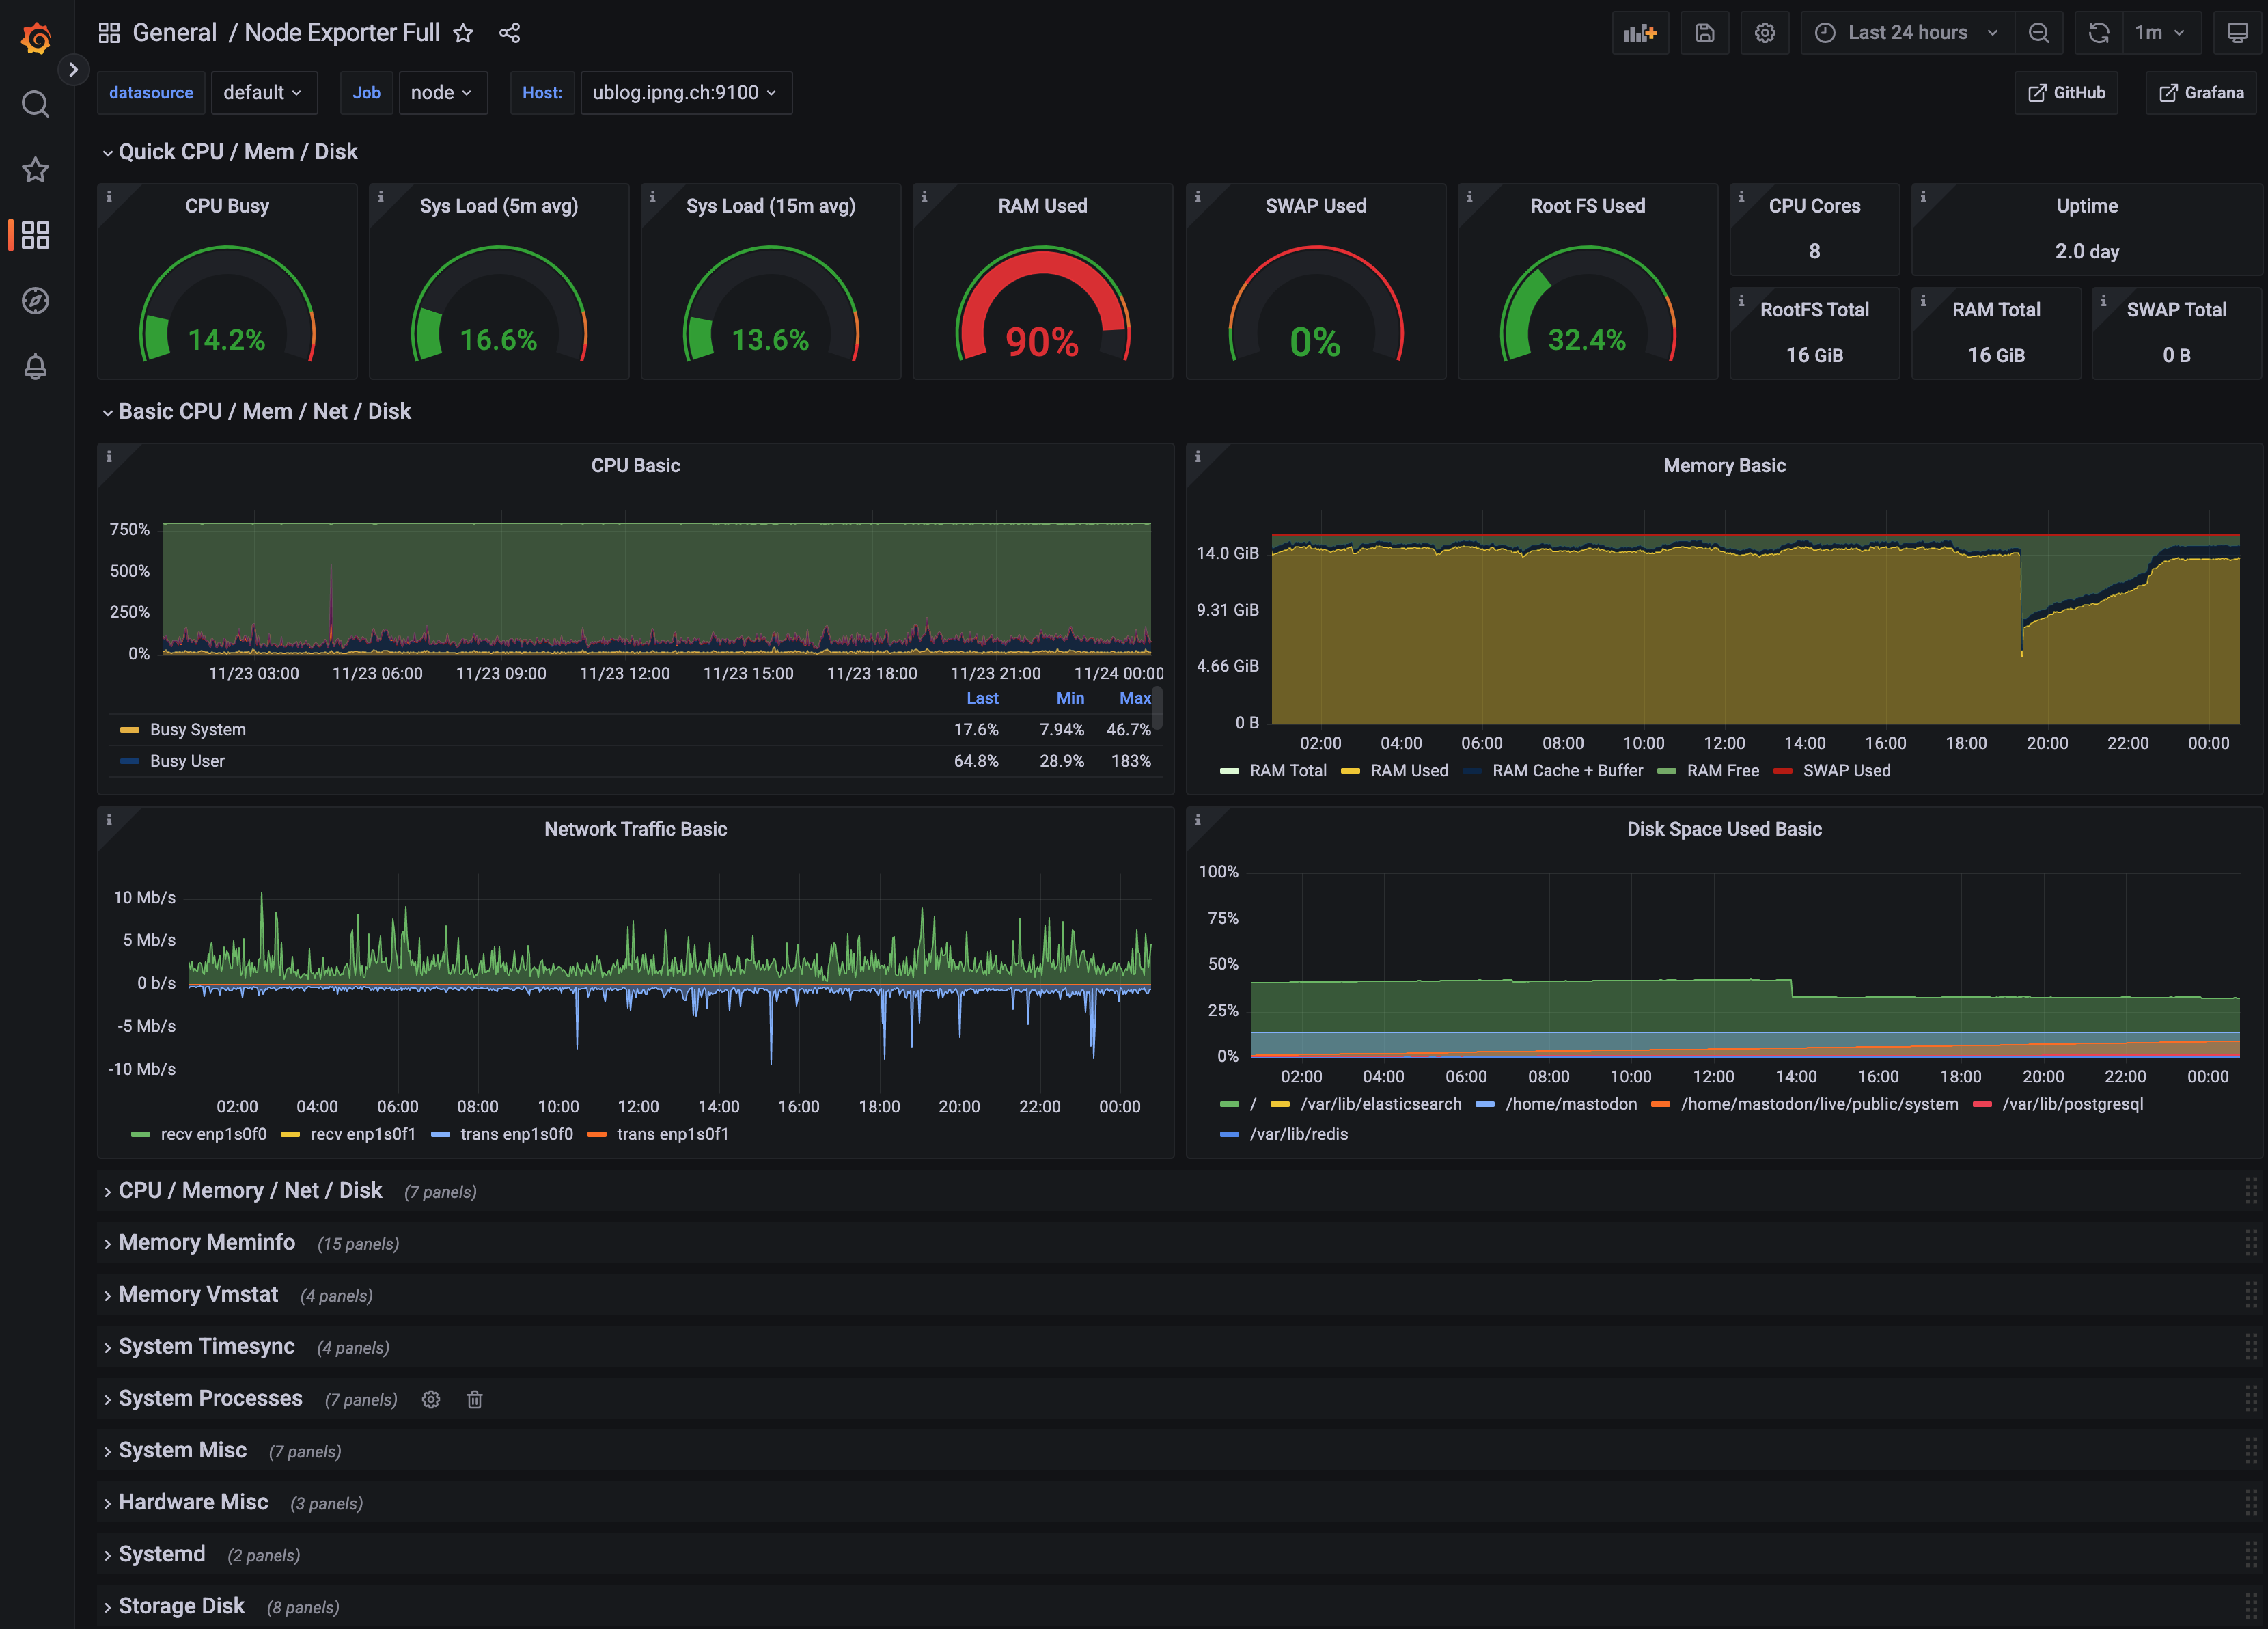
But while these dashboards are awesome, what I find has saved me (and my ISP, IPng Networks) a metric tonne of time, is the most fundamental monitoring in the Node Exporter dashboard, pictured to the right (bottom). What I really love about this dashboard, is that it shows at a glance the parts of the computer that are going to become a problem. If RAM is full (but not because of filesystem cache), or CPU is running hot, or the network is flatlining at a certain throughput or packets/sec limit, these are all things that the applications running on the machine won’t necessarily be able to show me more information on, but the Node Exporter to the rescue: it has so many interesting pieces of kernel and host operating system telemetry, that it is one of the single most useful tools I know. Every physical host and every virtual machine, is exporting metrics into IPng Networks’ prometheus instance, and it constantly shows me what to improve. Thanks, Obama!
What’s next
Careful readers will have noticed that this whole article talks about all sorts of interesting telemetry, observability metrics, and dashboards, but they are all common components, and none of them touch on the internals of Mastodon’s processes, like Puma or Sidekiq or the API Services that Mastodon exposes. Consider this a cliff hanger (eh, mostly because I’m a bit busy at work and will need a little more time).
In an upcoming post, I take a deep dive into this application-specific behavior and how to extract this telemetry (spoiler alert: it can be done! and I will open source it!), as I’ve started to learn more about how Ruby gathers and exposes its own internals. Interestingly, one of the things that I’ll talk about is NSA but not the American agency, rather a comical wordplay from some open source minded folks who have blazed the path in making Ruby’s Rail application performance metrics available to external observers. In a round-about way, I hope to show how to plug these into Prometheus in the same way all the other exporters have already done so.
By the way: If you’re looking for a home, feel free to sign up at https://ublog.tech/ as I’m sure that having a bit more load / traffic on this instance will allow me to learn (and in turn, to share with others)!